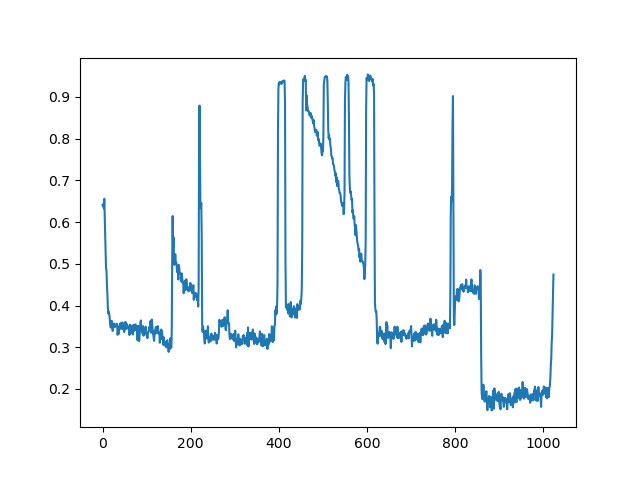
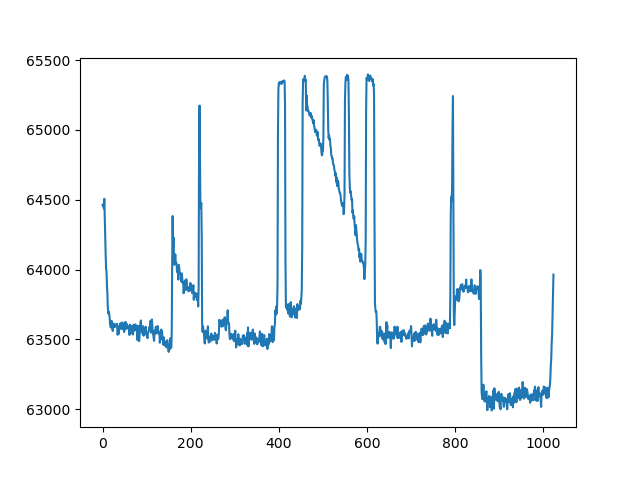
We used to do our analysis in v2.2.7 and now recently have changed to v2.3.2. The planar image analysis results are drastically different, and I think it’s because the images are now having a linear transformation applied. In the old version, when I write out my lc_rois I get values on the order of 59000 and now they’re on the order of 0.5.
How can I undo this linear transformation? (our analysis is based on baselines and I’d really like to not have to re-establish baselines)
I tried that and I’m now getting pixel values that are more in line with what I had before. That said, values of contrast and MTF are still very different. Previously I would have gotten contrast values of ~1 and now they’re ~4. And MTFs were on the order of 3.3 and now they’re ~0.5.
The way that I report contrast is qc3.low_contrast_rois[4].contrast*100. (In the old code it was round(qc3.lc_rois[4].contrast * 100,3)). [it was stupid of me to pick [4] but let’s ignore that) Did the ROI definitions (indexes) change at all? Did the calculation of contrast change? When I print out the ROI list they seem to come out in a different order in v2.3.2 compared to v2.2.7.
The MTF call I used before was qc3._mtf(50). Now I’m using qc3.mtf.relative_resolution(x=50). Is that the right way to call it? Not sure why the result should have changed so much.
Looks like the ROI indices were all increased by one? I was able to change my contrast to be [5] instead of [4] and now I’m getting the same results.
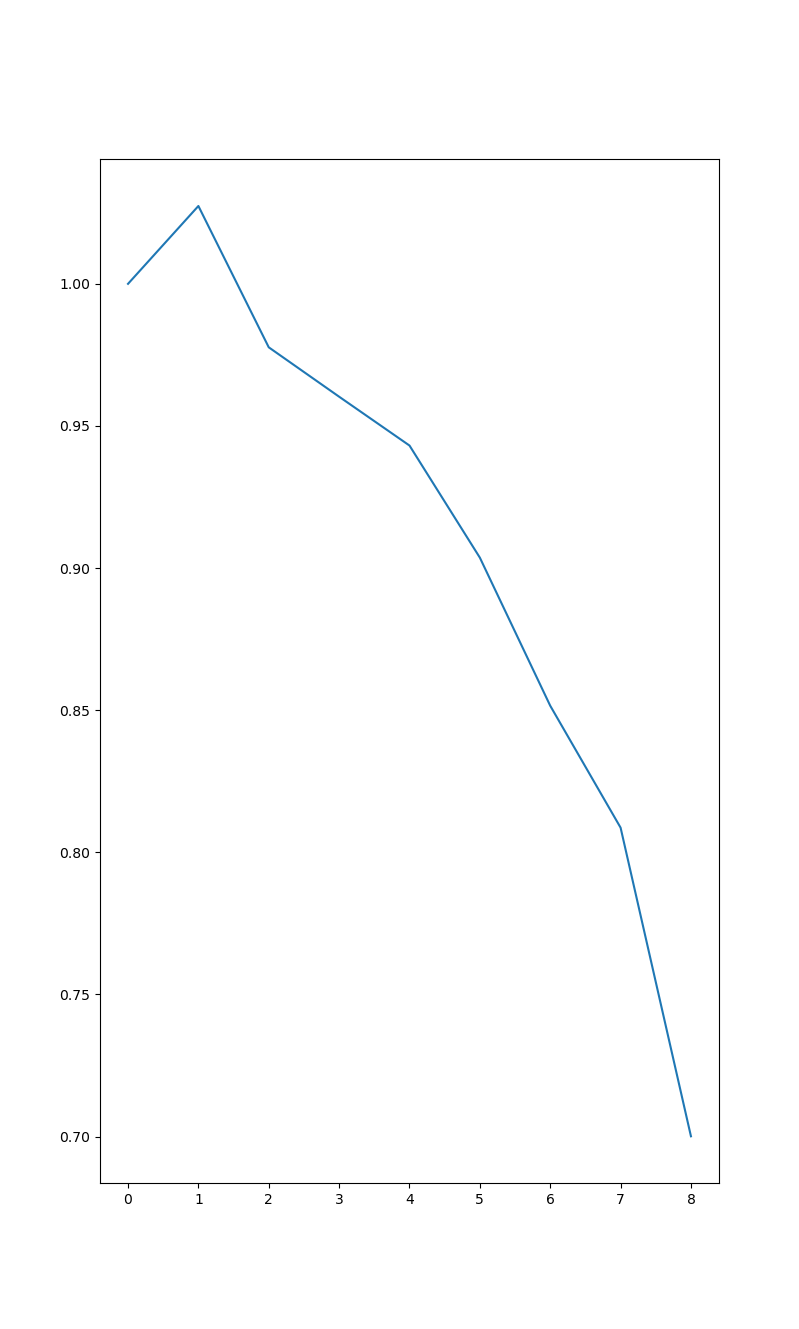
Looking at the old vs. new MTF results it looks like the old MTF was potentially giving a ‘region number’ as 3.3 rather than the actual line pair/mm. Can you confirm? Is there a way to still get that number in the new version?