I have a issue regarding MTF calculation in latest stable version of PyLinac
I Have qc3 phantom with a nominal calibration value of 0.74 lp/mm for MTF 30. When I use PyLinac for MTF calculation I got 0.94 for MTF 30, while PIPSpro will calculate MTF 30 equal to 0.754 which has less differences with calibration value in comparison with PyLinac. I was wondering what is reason for this differences and how can I handle that.
summary of result:
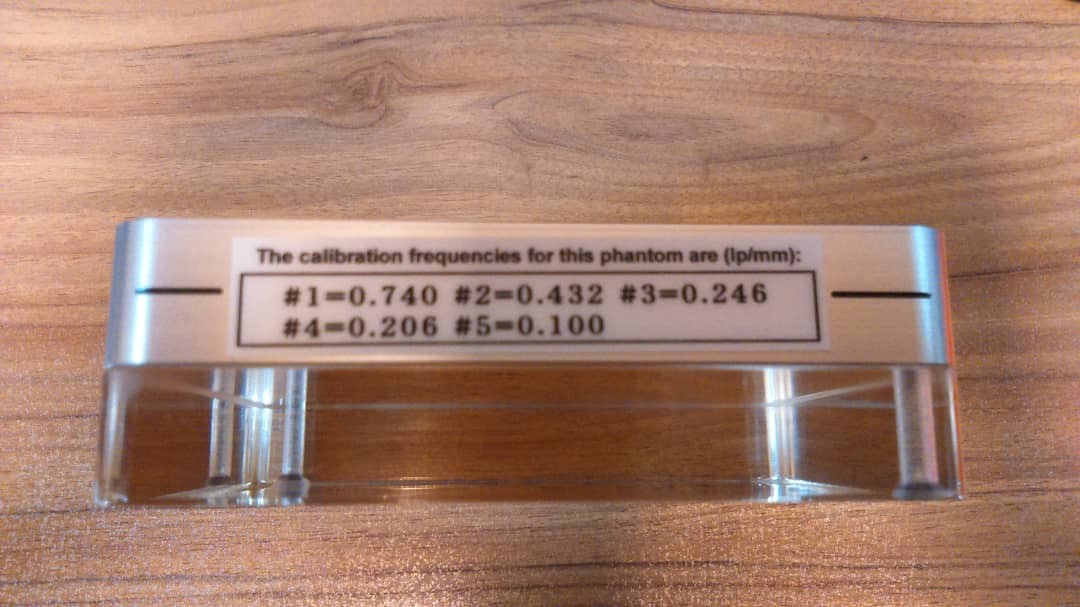
QC3 MTF calibration value for MTF 30: 0.74 lp/mm
PyLinac calculation for MTF 30: 0.94 lp/mm
PIPSpro calculation for MTF 30: 0.754 lp/mm
Without your image or result data it’s hard to say what’s going on. I’m not sure what the “calibration value” here is. Is this your commissioning data or something else?
you can find the QC3 phantom image in the attachment of this email(RI.GO.dcm). The calibration information can be found in the phantom.jpg file. as you can see in this image, the values for MTF 30 and MTF 50 are 0.74 and 0.432 respectively.
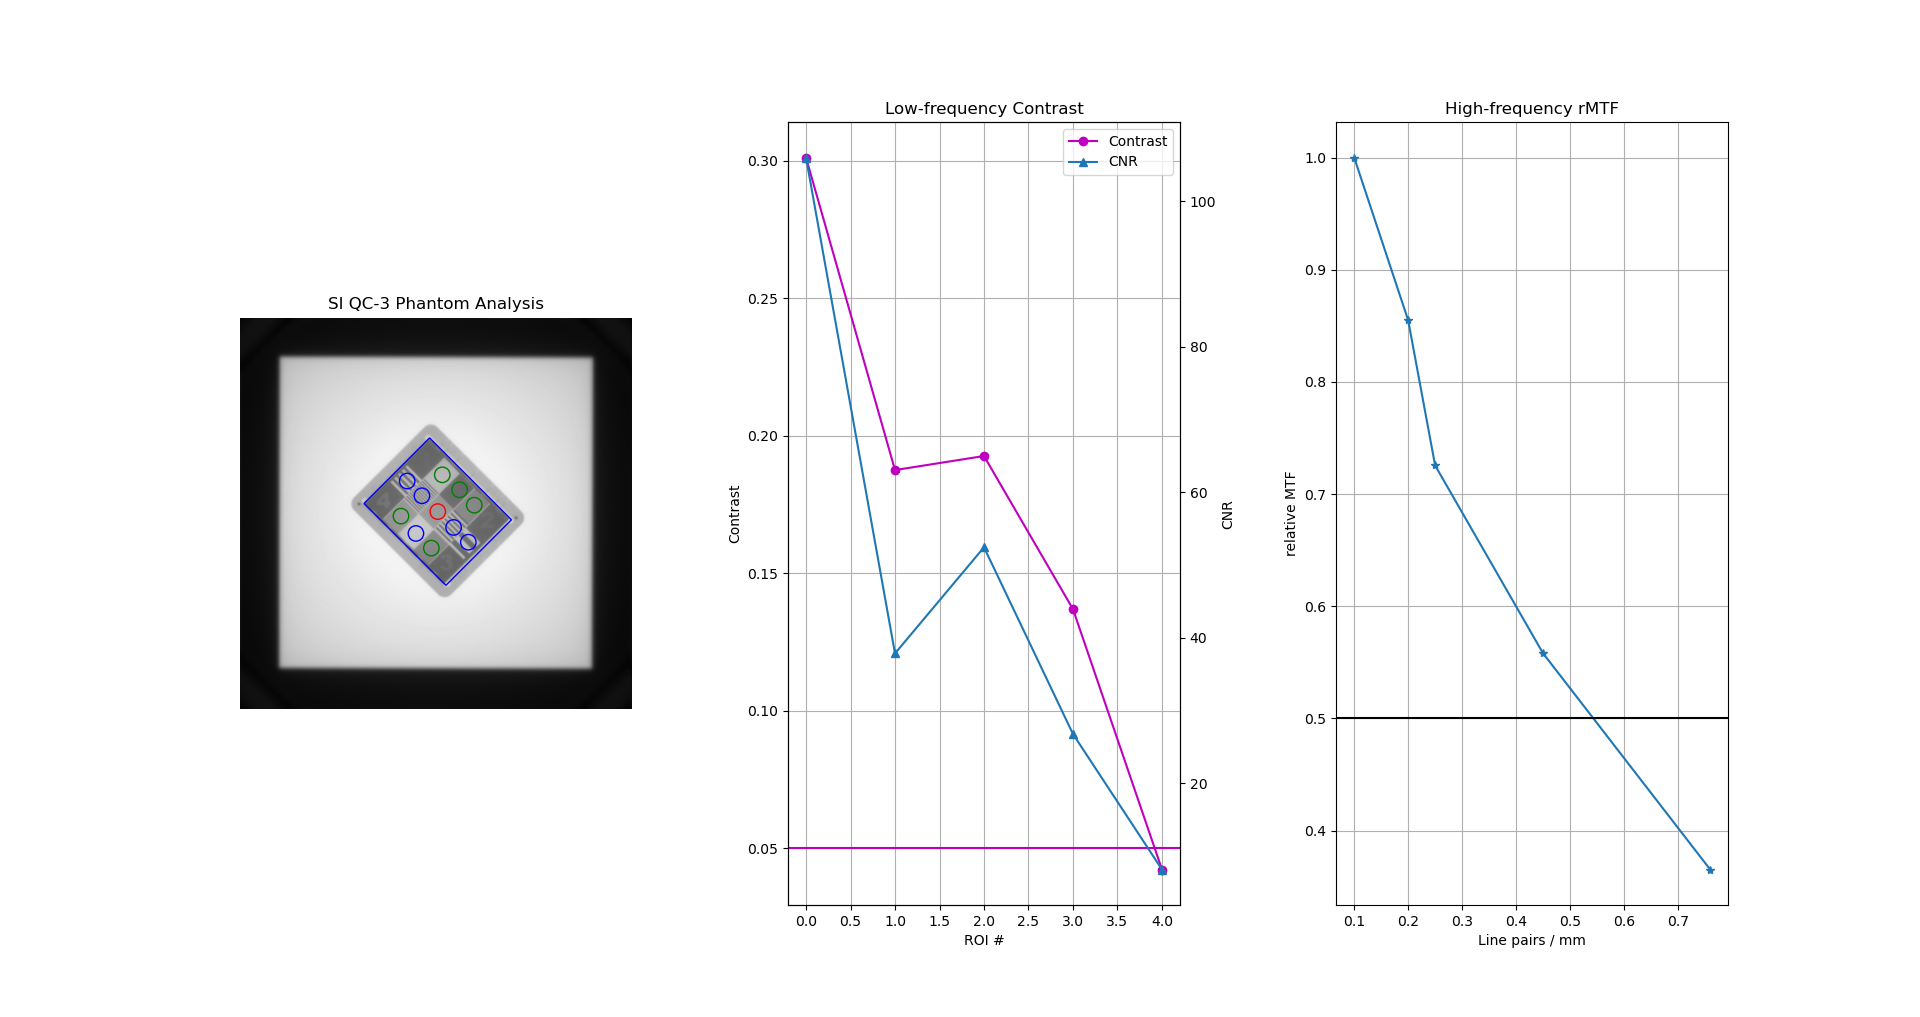
Here are the values of PyLinac MTF calculation for MTF 30 and MTF 50:
MTF 30 : 0.91
MTF 50: 0.60
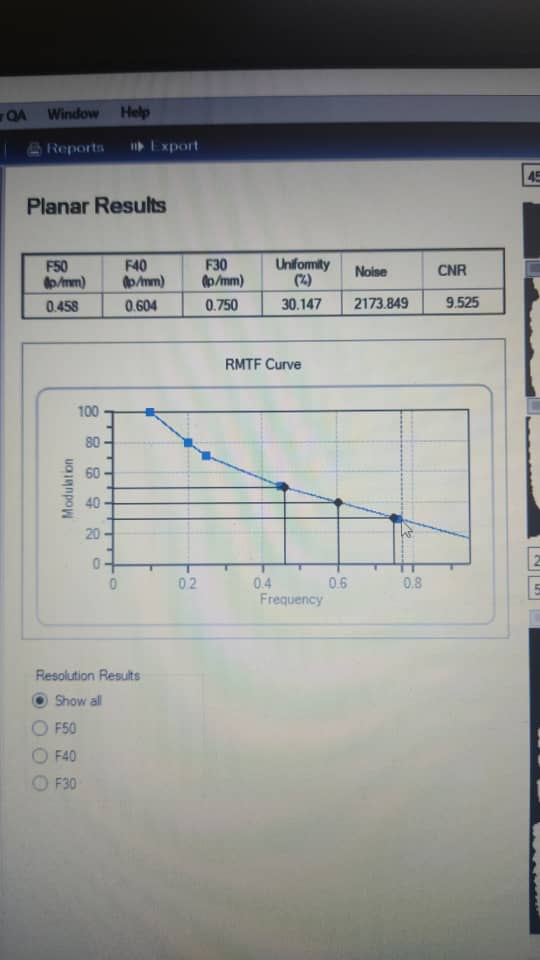
the values of MTF 30 and MTF 50 calculated by PIPSpro are (you can find the result in the attachment files (PIPSpro_result.jpg)):
MTF 30 : 0.75
MTF 50: 0.458
as you can see the MTF values calculated by PIPSpro have lower differences with calibration values than PyLinac calculation. I would be appreciated for an explanation of this difference.
I see a bit more now; I think there’s a misunderstanding. The 0.74 and 0.432 lp/mm are the known distances of the line pairs. Standard Imaging, nor any manufacturer, can make claims about the MTF of your system. The MTF is the IMAGING system’s ability to resolve line pairs. If your imaging system was perfect then the MTF would be 1.0 for all line pair regions. The fact that ~0.7 and ~0.45 also are your MTF 50 and 30 is a coincidence; for example, if you use a different energy you’ll get different values. The values on the phantom determine your x-axis. The y-values are a function of your imaging system.
As for the difference between PipsPro and pylinac, I can’t comment. Pylinac is open source and you can see how this is calculated here: pylinac/mtf.py at master · jrkerns/pylinac (github.com). You should also be cautious about MTF30 because pylinac is making an extrapolation of the data as there is no line pair region low enough to accurately calculate MTF30. See the attached pylinac image. When printing the results you should see a warning about this. Finally, since pylinac is reporting higher values than pipspro, my guess is that they are either using a slightly different equation or slightly different pixel calculations (e.g. percentiles instead of max/min). The pipspro manual should give you an answer there.
Thanks a lot for the perfect explanation. and for the last question, I had some trouble with finding qc3 phantom using Pylinac, with which version of PyLinac, you calculate this result and plot the analyzed result?
I used PyLinac 2.2.6 version for finding the phantom and used 3.0.0 to calculate the MTF and the corresponding results, I would be appreciated if you tell me what is your method for phantom detection, any code sharing would be helpful, thanks a lot for this great library.
The core of the phantom finding algorithm is here: pylinac/planar_imaging.py at master · jrkerns/pylinac (github.com) The majority of the algorithm leverages the scikit-image library, which is an amazing library for image analysis. pylinac uses a canny filter over the image to find the edges, then searches for regions that fit the physical size and shape of the phantom. The closest-fitting ROI is chosen and then the region properties (center, size, etc) are used to calculate the size, angle, position, etc.